


EXPERIMENTAL MONITORING NETWORK OF THE MISA AND NEVOLA RIVERS (Marche Region – ITALY) AND SMALLER WATERCOURSES (FOSSO SANT’ANGELO – Senigallia – Marche Region – ITALY)
DON’T MISS AN UPDATE!
Follow us on our Facebook page for all the news in real time.
Flooding is a natural phenomenon, widespread and common throughout the world, which can have a far-reaching effect on people and the environment. It is a rapid and excessive accumulation of water in a normally dry region caused by important and persistent atmospheric precipitations. The phenomenon is accentuated by some local characteristics such as the conditions and composition of the soil, its slope and the topography of the place.
We at RadioAstroLab and Fasar Elettronica, companies based in Senigallia that have been operating in the professional electronics sector for over 20 years, have developed and patented new concept sensors designing an innovative watercourse surveillance system called ProgettoRIO,initially dedicated to monitoring the Misa-Nevola river environment.
ProgettoRIO is based on two important concepts to ensure reliable monitoring of river environments:
1. To control the surface extent of the wetted area and its variations within the river basin.
2. To control the local evolution of tropospheric phenomena (rain).
The instrument shows changes in the watercourse over time and warns of potential environmental risks due to flooding. By continuously measuring some parameters of the river area and monitoring rainfall events, data are processed to represent the seasonal variations of the flood factor of the basin, the growth rate of the flooded areas and the speed of flood wave propagation, the dynamics of the waters, the frequency and intensity of rainfall.
The experimental activity of ProgettoRIO includes various monitoring stations distributed throughout the territory which, connected via radio, periodically transfer the acquired data to a control center located at the headquarters of the promoting companies. Each station consists of a RALrio sensor that observes the river environment and local tropospheric conditions (rain). The following map shows the currently active stations and a possible distribution of the monitoring points that will be gradually installed along the Misa-Nevola river route, in order to ensure effective surveillance of the basin.
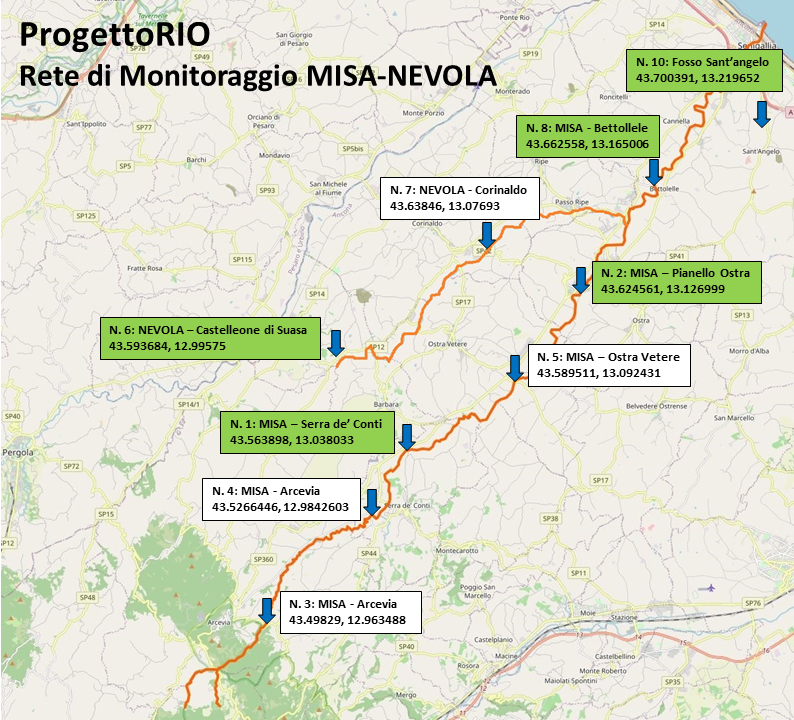
The green stations are currently active, the orange ones are being installed, the others have been proposed to the municipalities concerned and awaiting approval.
The network will be continuously operational and the control center will periodically query each station via a radio channel: the data will be acquired by the server of the operations center and processed to provide graphs showing the evolution over time of the percentage of flooding of the monitored areas, the speed of growth of the flooded areas and the turbulence of the waters. The information acquired can be further processed and correlated with the data provided by other public institutions (such as the national or regional meteorological service, for example) to generate alarms when certain thresholds are exceeded, managed by the competent administrative authorities and assisted by local Civil Protection personnel. Each RALrio sensor is designed to participate in the collective monitoring of the river environment and to provide, if necessary, local alarms if appropriately configured: using this information, it is also possible to develop mobile applications that warn and inform the population about the state of the river.
LET'S KEEP AN EYE ON THE RIVERS MISA AND NUVOLA
The following stations are currently installed:
Station N.3: Castelleone di Suasa (Nevola river, bridge Contrada Farneto)

Station N.1: Serra de' Conti (Misa river, Via Mulino bridge, Strada Provinciale 360 Arceviese)

Station N.2: Pianello di Ostra (Misa river, bridge at Strada Provinciale 360 Arceviese)

Station N.8: Bettolelle - Senigallia (Misa river, bridge at Strada Comunale delle Bettolelle)

Station N.10: Fosso S.Angelo - Senigallia (Strada Provinciale Sirolo - Senigallia)

ProgettoRio network management program, installed at the server of the control panel:
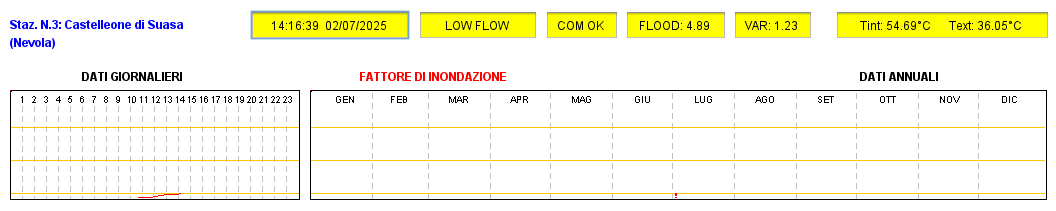


The monitoring windows associated with the active stations display, in real time, the progress of the measurements taken by each sensor. The red track represents the flood factor of the region monitored by the individual station. On a percentage scale, an increasing trend of the curve indicates increases in the extent of free water in the ground, witnessing a gradual flooding of the river basin. If this trend continues until the threshold value is reached, the risk of flooding is high. Conversely, a drought event occurs when the curve remains stable towards the lower limit of the graph.
The program queries each active station connected to the network with a period of 5 minutes. On the window of each station there is the name and its identification number.
We have developped an application for mobile devices that allows you to view current river conditions in real time, in the event of a message to specific recipients (mayors, local public security authorities, Civil Protection personnel). The data acquired by the remote stations is saved for further and subsequent processing.
The information visible on this page, which is accessible to all, is periodically updated when significant events occur. A page of our website is available with access reserved for local authorities where the graphs can be viewed in real time.
Historical monitoring data are available on request, collected in text format files for further processing or research work.
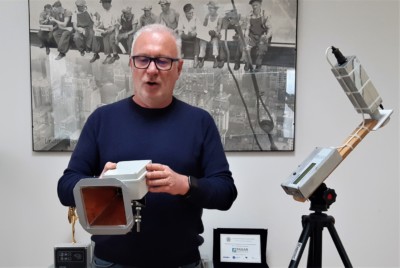
THE EQUIPMENT

Our sensros, developed and produced by RadioAstroLab with the support of FASAR Elettronica, estimate the surface content of water and moisture present in a river area by recording their variations over time, evaluating the dynamics of the water and detecting rainfall events that can influence the river regime. The regularly updated graphic representation of these parameters highlights very well the seasonal evolution of the river environment with its drought and flood events, providing a powerful tool for dealing with potential flood risks.
FUTURE DEVELOPEMENTS
ProgettoRIO is an innovative river basin surveillance system that, using innovative techniques, measures and visualizes the daily evolution of the percentage of flooding of the observed scenario and the dynamics of the liquid surface in order to formulate forecasts and raise alarms at the occurrence of river flood events with flood risk.
Its development possibilities are remarkable, both in terms of the number and type of sensors that can be used and for the possibility of acquiring, from specialized bodies through the web, data of national, regional and local meteorological interest on atmospheric conditions and, possibly, of the sea near the mouth of the river (waves, currents, winds). By integrating this information with the data acquired by the sensors, it is possible to develop reliable forecasting algorithms, valid sufficiently in advance to allow an effective and timely civil protection organization in the event of an emergency.
Let's Work Together
COLLABORIAMO INSIEME
Are you interested in this project?
Get in touch!